The Effect of Aircraft Size on Performance
(Preliminary Draft)
Ilan Kroo
December 1994
Update Sept. 1995.
Aircraft Aerodynamics and Design Group
Department of Aeronautics and Astronautics
Stanford University, Stanford, California
© 1994 by Ilan Kroo.
Introduction
A very simple study of the effect of aircraft size on performance and cost
illustrates some interesting results. It has been suggested that the square-cube
law may limit the feasible size of aircraft, and that proposed 600-800 passenger
aircraft may be approaching this limit. The current results suggest that
while a variety of practical issues may indeed limit the size of aircraft,
basic structural weight and aerodynamic performance considerations permit
aircraft of much larger dimensions.
There is, of course, reason to suppose that the square-cube law will at
some point limit the feasible size of aircraft. The wing weight, for example
would be expected to grow as W b^3 / S, just from bending strength considerations,
and so would comprise a larger fraction of the total weight of the aircraft
as the size and weight increased. However, the wing and fuselage structural
weight remain a small part of the total aircraft weight. Evaluation of the
importance of this effect requires a quantitative evaluation and this is
what is presented here in a simple form.
Method
To permit a rapid trade study, many parameters were held constant that would
be optimized in a more refined design. We assume, for the moment, that the
following geometric parameters are held constant: Wing AR, Sweep, t/c, airfoil
geometry, fuselage fineness ratio, tail area ratio, etc. We further assume
that the initial cruise altitude and Mach Number is specified.
Now, in practice, larger aircraft are designed for longer ranges and permit
larger take-off and landing field lengths, but for this study, we design
a wide range of aircraft for the same range and field length requirements.
For flight at Mdiv, the wing CL is limited, so we consider aircraft of constant
wing loading. With fixed wing loading, we achieve similar TO performance
with constant T/W, and apart from differences in lapse rate for different
size engines, the initial available cruise thrust to weight ratio is fixed.
With these assumptions, the calculations proceed as follows.
- Specify a fuselage cross-section from an existing or proposed aircraft.
- Compute the number of passengers based on the assumed fuselage fineness ratio.
- Iterate on take-off weight until the range is equal to the desired range.
- For each TOW, compute wing area from the cruise CL constraint, sea level static thrust from the take-off field length constraint, component weights, then L/D and range.
The basic methodology is described in reference 1, but the key features are summarized in the following sections.
Drag build-up
The aircraft drag is computed by a conventional component build-up method that includes parasite, induced and compressibility drag. The aircraft zero lift drag estimation involves computing skin friction based on flat plate boundary layers for each major component with form factor corrections for thickness. Roughness effects are estimated empirically. Lift-dependent drag includes vortex drag and lift-dependent viscous drag. Compressibility drag is estimated using a combination of theoretical and empirical results based on the section crest critical Mach number and simple sweep theory.
Weights
Component weights are computed using the semi-empirical methods of reference 1. This involves a variety of system weights as well as major structural weight items that computed based on fully-stressed sizing criteria and then scaled based on empirical data. The wing and tail surface weights are based on a fully-stressed bending-dominated weight calculation, while it is assumed that the fuselage structure is pressure-dominated.
Propulsion
A single rubberized engine deck is used here with no benefit of size on tsfc. The engine dimensions are scaled with sqrt(Thrust) while the weight is assumed to scale linearly with thrust. The thrust lapse and sfc values are typical of modern bypass ratio 6-8 engines.
Cost/Price
A variant of the ATA method is used to estimate DOC, however, individual components are individually costed using more recent data from Douglas. Aircraft price is an especially questionable result, but for the purposes of this study, we are not interested in precise values.
Results
Computations were performed for aircraft ranging from a 4-abreast commuter to a triple-deck monster with 29 seats in the cross section.
The following parameters were selected based on analysis of the baseline design:
5000  Required Range (n.mi.)
30    Wing Sweep
130   Wing Loading W/Sw (lb/ sq ft)
8     Wing Aspect Ratio
.30   Sea Level Static Thrust to Weight
467   VCruise (kts)  (Mach = .80)
32000 Initial Cruise Altitude
A variety of additional parameters were selected based on typical transport aircraft.
Basic results are shown in the table below for each cross-section that was selected. The first column indicates the number of seats in the cross-section. This is the same as the number of seats abreast in a single deck arrangement. The value of 12 for a 747-like design is an average value as the aircraft upper deck does not extend over the full length of the fuselage. The fuse width and height are shown next based on existing or proposed aircraft layouts. Also included in the table ate NSeats, the total number of seats assumed; TOW, the computed Take-Off weight that meets the range requirement; Sw, the wing reference area; L/D, the lift-to-drag ratio at start of cruise; the wing span; the thrust to drag ratio at start of cruise; DOC, the direct operating cost; the estimated aircraft price (in millions of dollars) and the price per seat.
Seat Fuse  Fuse Nseats TOW  Sw   L/D   span  T/D   DOC    Price k$/pax type
Abst Width Ht   Total   lb ft^2        ft          c/s-m   $M
------------------------------------------------------------------------------
4     8.7  8.7   68   92   707   16.1   75   1.23   4.77   11.6  170  Commuter
5    10.6  10.8  100  137  1054  16.4   92   1.25   4.13   15.4  154  MD80
6    12.3  12.3  138  190  1461  16.8   108  1.28   3.73   19.9  144  757
7    16.5  18.1  217  336  2585  16.9   144  1.29   3.66   32.9  152  767
8    18.5  18.5  280  435  3346  17.4   164  1.33   3.49   41.2  147  A310
9    20.3  20.3  351  555  4269  17.8   185  1.36   3.40   52.9  151  777
9    20.3  20.3  351  558  4292  17.7   185  1.35   3.50   53.1  151  3-eng 777
12   21.3  25.7  492  770  5923  18.2   218  1.39   3.32   72.3  147  747-400
16   22.2  28    672  1025 7885  18.7   251  1.43   3.10   95.2  142  A3xxx
19   25.6  31.1  931  1460 11231  19.4  300  1.49   3.06  136.0  146  NLAStretch
29   27.9  33.6  1537 2500 19231  20.0  392  1.53   3.03  232.5  151  Enormous
Discussion
These results are, in some ways, surprising. The expected square-cube law effect, making the largest aircraft uneconomical is not observed. Rather, DOC is seen to decrease even for the largest aircraft.
The following results should be noted:
- 1. The L/D increases with aircraft size, due primarily to Reynolds number effects, but also to the more efficient use of fuselage volume for the 2 and 3 deck arrangements which tend to reduce the ratio of fuselage to wing wetted areas.
- 2. Because of the improved L/D, the engine thrust margin at the initial cruise condition increases. The fixed T/W is maintained for take-off and climb requirements, but some opportunity exists for exploiting this effect on the larger aircraft. This would further improve their performance.
- 3. Although the engine T/W was fixed to maintain take-off performance, the larger aircraft employ 3 or four engines while the smaller aircraft are twins. The estimated TO field length for the 4-engine aircraft is thus smaller than that of the twins, so for comparable field length performance we should have reduced T/W, further improving the large aircraft performance.
- 4. The DOC estimate here does not include financing cost, but the total aircraft cost per passenger is remarkably constant, so including this would not be expected to reverse the trend of improved economics up to extremely large aircraft.
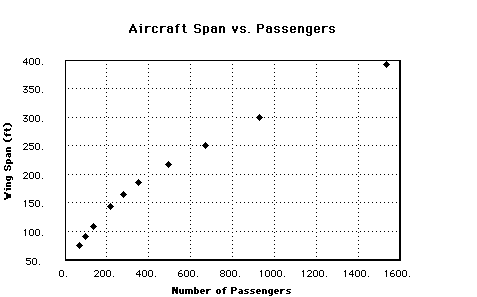
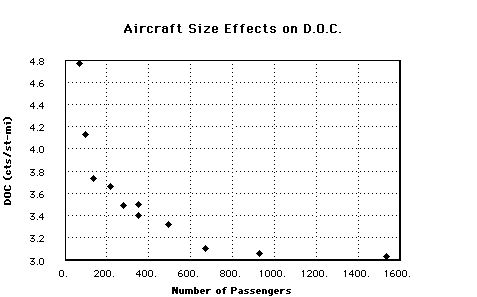 Note that DOC continues to decrease as the number of passengers gets very large, but almost all of the savings is achieved by 600-800 passenger aircraft. Moreover, other considerations make such aircraft problematic. The figure below illustrates the variation of wing span with number of passengers, again showing that 600-800 passengers represents a reasonable upper bound, at least for these conventional aircraft.
Conclusions
The fundamental conclusion is that basic aerodynamics and structure do not limit the size of aircraft that can be operated economically. Issues such as airport compatibility, scheduling, passenger loading and servicing, emergency egress, and other practical considerations are, most likely, the principal concerns.
These advantages for the larger aircraft tend to offset some of the disadvantages related to square-cube-law scaling and make even extremely large aircraft good performers. However, little net performance gain is seen with aircraft designed to carry more than 600-800 passengers and because of practical considerations, this seems to represent a reasonable limit to aircraft size.