
Email: mcmu@stanford.edu
| Aerospace Computing Lab | Aero/Astro Department | Stanford University |
| Background |
| Education/Experience |
| Papers |
| Publications |
| Presentations |
| Posters |
| Research |
| NLFD Overview |
| NLFD-Cylinder |
| NLFD-Airfoil |
| NFLD vs Dual Time Stepping |
Vortex Shedding in Low Reynolds Number Flows Past Cylinders
Laminar vortex shedding occurs behind a circular cylinder over a range of Reynolds numbers between 40 and 194. Unsteady vortices alternately shed from the leeward surface of the cylinder forming an ordered wake known as the von Karman vortex street. This page presents results from NLFD calculations of the cylinder test case and compares them with similar data from experiments and other numerical computations. Temporal and spatial resolution surveys are included to show the convergence these results exhibit as a function of diminishing numerical error.
The temporal resolution survey covers four solutions using one, three, five and seven time varying harmonics. The flow field, as it exists in nature, obviously contains a larger number of modes. During the computation, these unresolved modes transfer energy back into lower frequencies in a corrupting process known as aliasing. This effect is a function of the magnitude of the unresolved modes, which are unknown in the absence of an exact solution. This resolution survey looks at solution changes with varying resolution in order to identify an answer that is independent of aliasing affects.
The spatial resolution survey employs the four grids. To ensure a systematic search of the solution space, the survey computes every permutation of the four temporal and four spatial discretizations at 10 equally spaced Reynolds numbers within the range of Reynolds numbers admitting laminar vortex shedding. The results show that the relative magnitude of the higher harmonics grows with increasing Reynolds number. The changing distribution of energy between modes affects aliasing and further tests the capabilities of the NLFD method to accurately resolve the solution.
| Variable | Values |
| Temporal Resolution | 1,3,5,7 |
| Grid Resolution | 129x65,193x81,257x129,385x161 |
| Reynolds Number | 60,70,80,90,100,110,120,130,140,150 |
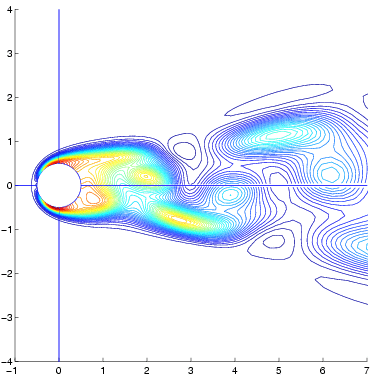
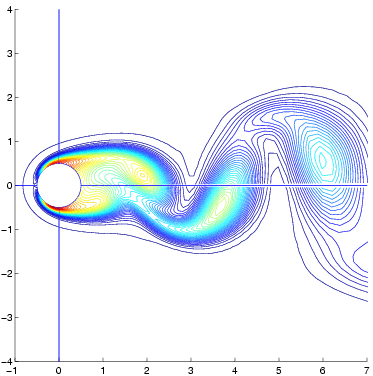
Provided below are entropy contours at the extremes in temporal resolution showing the qualitative difference in the solution with changing temporal accuracy. Because the energy contained in the higher harmonics increases with increasing Reynolds number these contours have been provided for the most challenging case; a Reynolds number of 150.
Entropy Contours
|
385x161 Grid - 1 Time Varying Harmonic
|
385x161 Grid - 7 Time Varying Harmonics
|
 |
 |
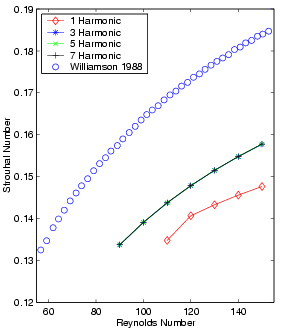
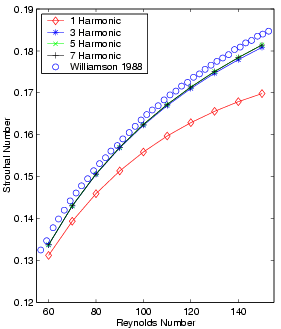
This page also provides a more quantitative comparison of the numerical and experimental results based on Strouhal number. The figures below provide the Strouhal frequency statistics as a function of Reynolds number. Each subplot presents results from a different grid while each line represents the locus of solutions computed at a single temporal resolution over a range in Reynolds numbers. For comparative purposes, Williamson’s [C.H.K. Williamson, Defining a Universal and Continuous Strouhal-Reynolds Number Relationship for the Laminar Vortex Shedding of a Circular Cylinder. Phys. Fluids, 31:2742, 1988a.] experimental data is overplotted on the graphs with circles. At the low end of the Reynolds number range, several of the coarse grid calculations did not support an unsteady solution. These coarser grids have substantial amounts of artificial dissipation which effectively lowers the Reynolds number of the computation. This shift can move a computation from a Reynolds number supporting unsteady flow into a regime where only steady symmetric separation is admitted.
Strouhal Number vs Reynolds Number
| 129x65 Grid - All Temporal Resolutions | 385x161 Grid - All Temporal Resolutions |
 |
 |
This section compares the results of calculations using variable- and fixed-time-period methods to show their relative merits. Two sets of data have been generated. The first set consists of all the spatial, temporal and Reynolds number permutations using the GBVTP method. The second set contains the exact same permutations as in the first, except that the time period is held fixed throughout the calculation. The Strouhal value for these calculations is derived from a curve fit based on Williamson’s experimental data. Because the fixed-time-period calculations use the experimental Strouhal data, a comparison between these two data sets based on Strouhal number would simply replicate the results presented above. Instead the comparison will be based on the value of the base suction pressure coefficient, which is the negative mean pressure coefficient at the far leeward edge of the cylinder. The figures below show the base suction cofficient as a function of Reynolds number. Each subplot presents results from a different grid, while each line connects all the data points calculated using the same temporal resolution over a range in Reynolds numbers. In general, the difference between the NLFD and experimental datasets decreases as the Reynolds number decreases. Surprisingly, this difference on the finest mesh is smaller than the difference between the Henderson [R.D. Henderson. Details of the Drag Curve Near the Onset of Vortex Shedding. Physics of Fluids, 1995] results and the experimental data over the entire range in Reynolds numbers.
Base Suction Coefficient vs Reynolds Number
| 129x65 Grid - All Temporal Resolutions | 385x161 Grid - All Temporal Resolutions |
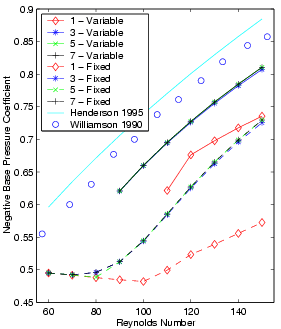 |
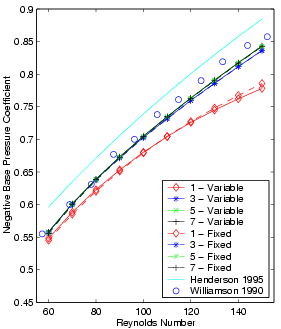 |
Movies for the vortex shedding case are provided via the following links. The animations are roughly 10MB in size, and show contours of entropy for various temporal resolutions. Each link title provides this temporal resolution as a function of the number of harmonics used in the simulation. Please note that the number of harmonics does not include the time average.
Last Modified: March 20 18:08:00 PDT 2003